
Visual Studio 2017 Mobility: Use what you know
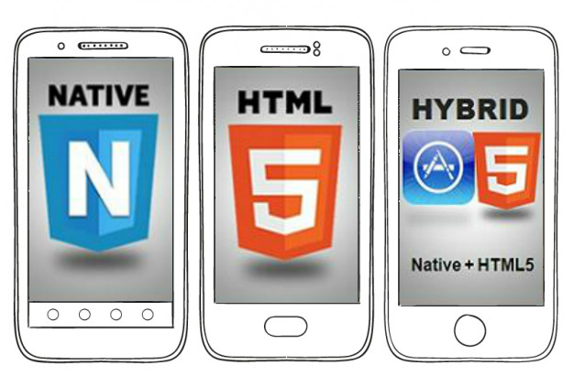
/It can be quite daunting to try to decide what is the best language for a particular app you have in mind, especially when writing mobile apps. Should you write a shell wrapper that resides on the device and does all the heavy lifting by calling your web application and processes? Or should you write it in the each native language, like Swift and Java, that stores all of the data and does all the processing on the device? That's a heck of a lot of code and rewriting the same thing over and over. Plus what kind of devices would you be restricted to to be able to run it based on the computing power needed? Or maybe you think you want to write it using response web frameworks. More and more, a hybrid model makes more sense, one that stores some of the data and does some of the computing on the device, but also utilizes web calls to do the heavy lifting.
I was honored recently to be able to speak at the Los Angeles Visual Studio 2017 Launch Party on this very topic.
Write what you know.
If you've ever tried to write that Great American Novel or taken any kind of writing class, you've probably heard this advice more than a dozen time. Write what you know.
This is just as important when it comes to writing code, even when crossing platforms.
If you are a C# developer, you can certainly write for the Windows platform with no problem. You should know though that you can use Xamarin tools to build applications to all types of devices and operating systems, like iOS and Android, using C# for the backend processing and either building the UI using native languages or Xamarin Forms to do it using XAML. And since Microsoft acquired Xamarin last year, its tools and functionality have been available as part of Visual Studio. It is even available as part of the free version of Visual Studio known as Community.
If you are a web developer, you can use your HTML, CSS and JavaScript skills to write apps using Visual Studio 2017 and TACO (Tools for Apache Cordova). Add to that the use of PhoneGap and the Ionic, a JavaScript framework for mobile to the cocktail and you are humming on all cylinders.
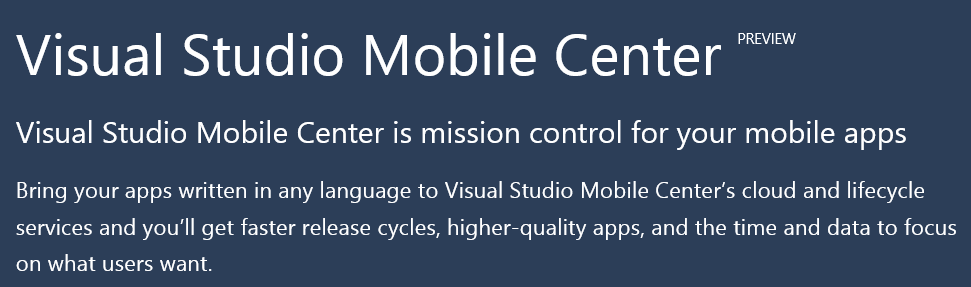
Lastly, take a look at the new Visual Studio Mobile Center, currently in Preview. This is your one-stop shopping portal for all of those things that you used to have to discover, consume and manage separately, bringing them all together under one roof for the mobile developer. Need to be able to manage Application Lifecycle activities, for build, test and distribute? Got it! Need to authenticate without changing your backend? Or use Facebook, Google, Twitter or a Microsoft Account to authenticate? Got it! For testing and running analytics like for crashes (backed by HockeyApp's crash reporting features), events metrics, and session metrics like how long a person is in your app (backed by Xamarin Test Cloud and Insights as well as Azure Mobile Experience), using the Mobile Center Analytics suite is the ticket.
Links:
Mobile Center
https://www.visualstudio.com/vs/mobile-center/
Mobile Center Preview Link
Tools for Apache Cordova (TACO)
https://www.visualstudio.com/vs/cordova/
Ionic 2 Templates for VS2017
NPM Task Runner
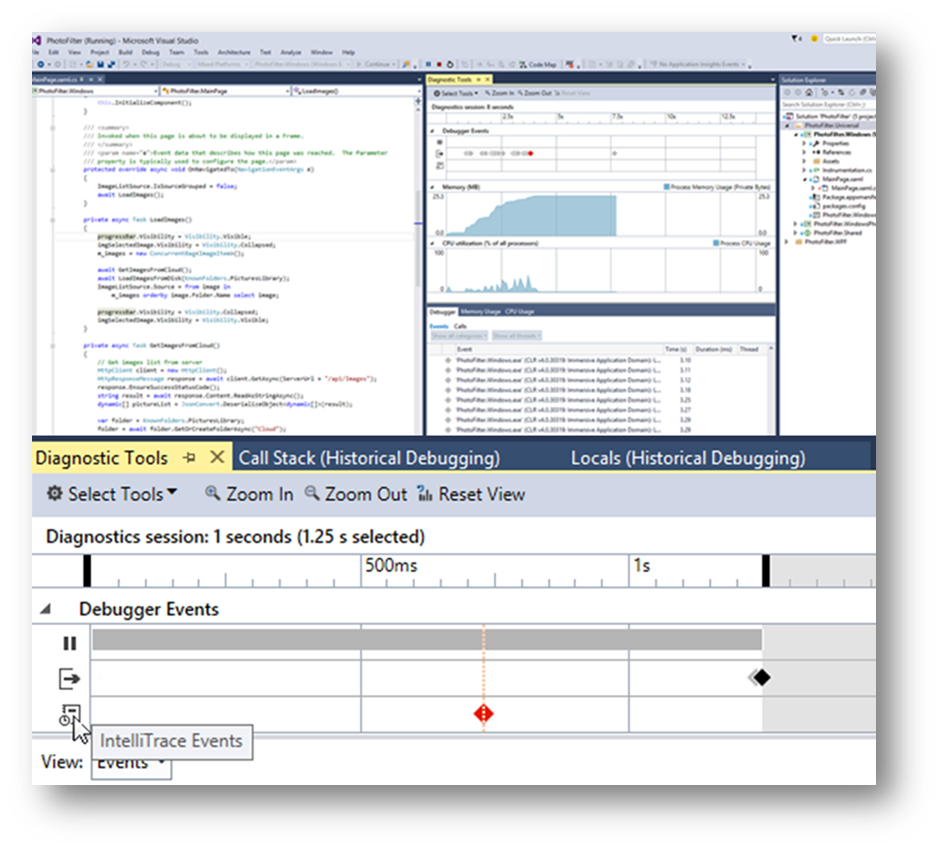 A new summary tab has been added to the Diagnostic Tools Window that let's you view the number of